The boundary between data engineering and ML engineering has always been somewhat artificial. A model degrades in production. Is it a model problem? The data feeding it changed. Is it a data pipeline problem? The features it receives don’t match what it was trained on. Is it a feature store problem? These questions point to the same underlying issue: the observability tools for data pipelines and the observability tools for ML models are separate, making cross-boundary diagnosis difficult.
MLflow 3, released in 2025, moved toward addressing this by expanding its scope beyond experiment tracking into GenAI tracing, agent evaluation, and closer integration with data quality monitoring. Databricks’ Data Quality Monitoring feature provides a framework for applying model-style monitoring (drift detection, statistical distribution tracking), to datasets and pipeline outputs, not just model inference results.
Together, these capabilities push toward a vision where data lineage, feature freshness, model performance, and inference quality are visible through a single observability surface rather than four separate tools.
MLflow 3: What Changed
MLflow’s original value proposition was experiment tracking for classic ML: log parameters, metrics, and artifacts for each training run, compare runs across experiments, promote the best run to a registered model. This remains the core, and MLflow 3 doesn’t break it.
What MLflow 3 adds is a significantly expanded observability scope:
GenAI tracing. MLflow’s mlflow.tracing API captures the full execution trace of LLM calls, including prompts, completions, tool invocations, and latency at each step. For RAG pipelines and multi-agent systems, tracing shows exactly which retrieval steps and which LLM calls contributed to a final response:
import mlflow

# Enable automatic tracing for LangChain or LlamaIndex
mlflow.langchain.autolog()

# Or manual tracing for custom pipelines
with mlflow.start_span(name="document_retrieval") as span:
    docs = vector_store.similarity_search(query, k=5)
    span.set_attribute("num_docs_retrieved", len(docs))
    span.set_attribute("query", query)

with mlflow.start_span(name="llm_generation") as span:
    response = llm.invoke(prompt)
    span.set_attribute("model", "gpt-4o")
    span.set_attribute("input_tokens", response.usage.prompt_tokens)
    span.set_attribute("output_tokens", response.usage.completion_tokens)
Agent evaluation. MLflow provides mlflow.evaluate() with built-in metrics for RAG and agent workflows: answer relevance, faithfulness (does the answer reflect the retrieved context?), context recall, and hallucination detection. This brings the same experiment comparison discipline that works for classical ML metrics to GenAI quality evaluation.
Dataset tracking. MLflow 3 extends the mlflow.log_dataset() API to record not just the name and version of training datasets, but their statistical properties: row counts, column distributions, null rates. This creates a traceable link from training data quality to model performance.
Training Data Lineage in Practice
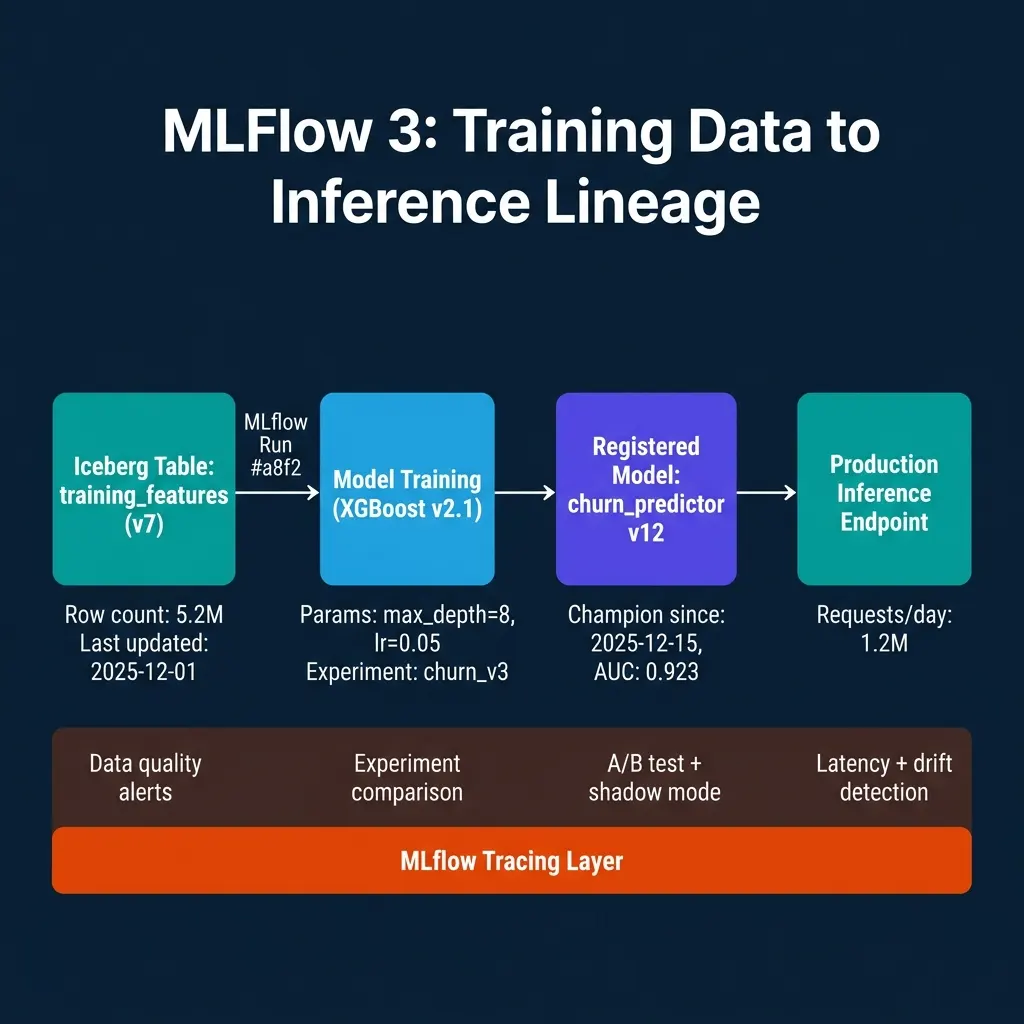
The data pipeline integration starts at training time. When a model training run references a specific version of a training dataset, that reference should be recorded in MLflow alongside the model parameters and metrics. MLflow’s dataset logging API connects to data sources including Iceberg tables, Delta tables, and pandas DataFrames:
import mlflow
import pandas as pd

with mlflow.start_run(run_name="churn_v12_training"):
    # Log the training dataset with metadata
    training_data = load_from_iceberg("training_features", snapshot_id=102345)

    dataset = mlflow.data.from_pandas(
        training_data,
        source="s3://data-lake/iceberg/training_features/",
        name="training_features",
        targets="is_churned"
    )
    mlflow.log_input(dataset, context="training")

    # Train model
    model = train_xgboost(training_data)

    # Log metrics and model
    mlflow.log_metric("auc", evaluate_auc(model, validation_data))
    mlflow.xgboost.log_model(model, "model")
Now when investigating a model degradation, you can trace the MLflow run for the current production model, check which dataset snapshot it was trained on, compare the statistical profile of that snapshot against the current training features table, and identify whether the training distribution has drifted.
Data Quality Monitoring for ML Inputs
Databricks’ Data Quality Monitoring applies model-style monitoring to datasets: statistical distribution tracking across time windows, drift detection against a baseline, and alerting when distributions change beyond a threshold.
For ML platform teams, this means data quality metrics and model performance metrics can be tracked in the same observability framework. A drop in model AUC correlates with a detected distribution drift in the user_recency feature, the data quality monitor fired three days before the model quality dropped, which is the right time to investigate and retrain.
# Databricks Data Quality Monitor configuration (Python SDK)
from databricks.sdk import WorkspaceClient
from databricks.sdk.service.catalog import MonitorMetric, MonitorSpec

client = WorkspaceClient()

# Create a data quality monitor for a feature table
client.quality_monitors.create(
    table_name="prod_catalog.features.user_activity_features",
    assets_dir=f"/Shared/monitors/user_activity_features",
    output_schema_name="prod_catalog.data_quality_metrics",
    time_series=MonitorTimeSeries(
        timestamp_col="feature_timestamp",
        granularities=["1 day"]
    ),
    baseline=MonitorBaseline(
        table_name="prod_catalog.features.user_activity_features_baseline"
    )
)
The generated quality metrics (column-level drift scores, null rate changes, distribution summaries), are written to a Unity Catalog table. They can be joined with MLflow experiment data to correlate data quality events with model performance changes.
Unified Observability Architecture
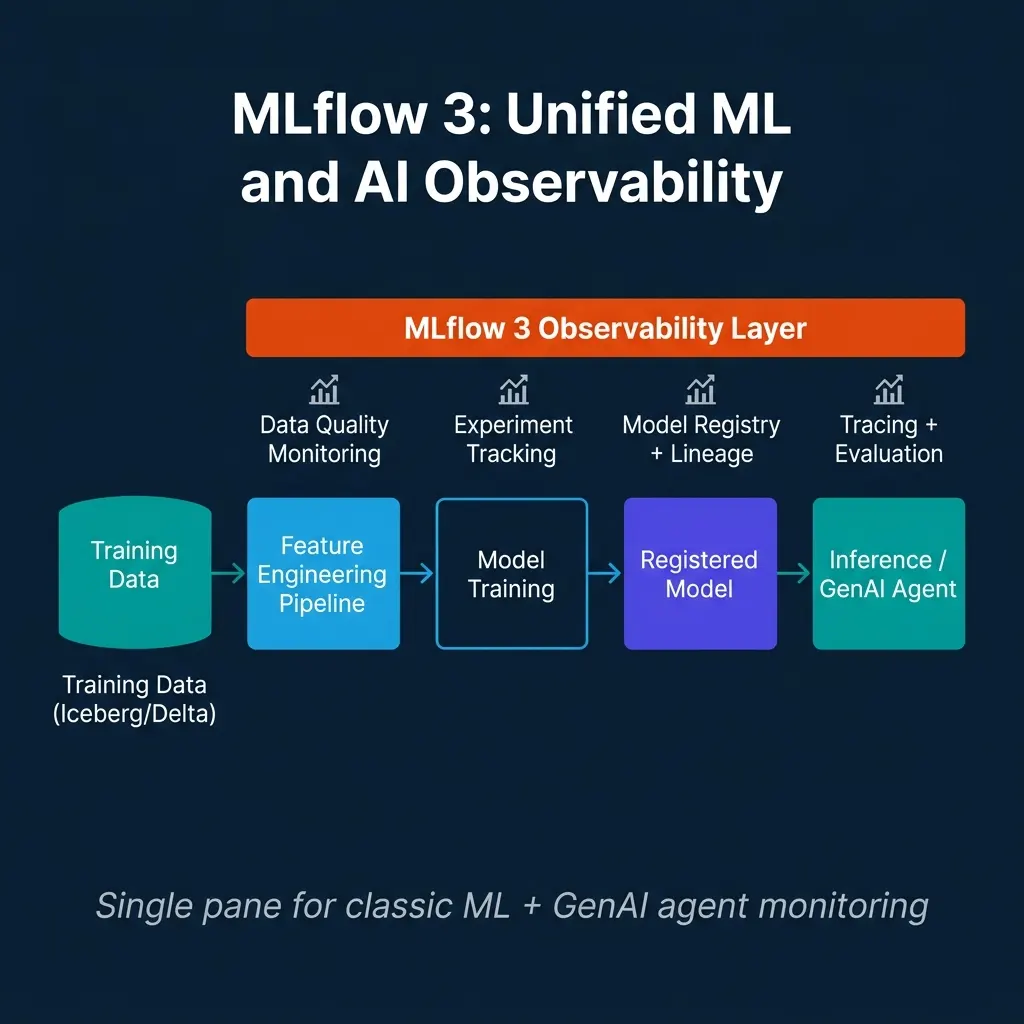
The practical implementation connects three systems:
-
OpenLineage or Databricks Unity Catalog provides dataset-level lineage: which jobs read and wrote which tables, and when.
-
MLflow provides model-level lineage: which dataset version trained which model, what the metrics were, and what the current production model’s trace looks like.
-
Data Quality Monitoring provides feature-level drift signals: when the statistical properties of model inputs change.
An on-call engineer investigating a model quality alert can navigate this chain: check the model’s MLflow run to see which dataset snapshot it was trained on → check the data quality monitor to see if the current feature distribution matches the training distribution → check lineage to find which upstream jobs modified the features → check the Airflow run history to find the failing job.
This investigation path is possible today with a combination of tools. The direction of both MLflow 3 and Databricks’ monitoring features is to reduce the manual connection between these layers.
Distinguishing Model Drift from Data Drift
One of the most practically useful applications of unified observability is separating model drift (the model’s predictions are degrading because the model itself is outdated) from data drift (the data feeding the model has changed, but the model’s logic would still work correctly if the data were as expected).
Without integrated observability, every model performance degradation alert requires the same investigation: pull the production predictions, compare against ground truth labels (where available), check feature distributions, check data pipeline logs. This process takes hours even for experienced teams.
With unified observability:
Data drift detection fires first. The data quality monitor detects that user_session_count_7d has a mean of 2.1 versus the training baseline of 4.3. This statistical anomaly is logged three days before model performance begins to degrade visibly.
Lineage traces the cause. The lineage graph shows that user_session_count_7d is computed from the user_sessions table, which was modified by a pipeline run on a specific date. The pipeline run log shows a schema migration that silently changed the session window from 7 days to 1 day.
The model is not broken. Reverting the session window computation restores the feature to expected distribution, and model performance recovers. A full model retrain was not necessary.
This scenario (data pipeline bug causing model degradation that looks like model drift), is common enough that teams without integrated observability routinely retrain models unnecessarily. The retrain is expensive (compute cost, team time, validation process) and doesn’t fix the underlying data pipeline issue.
# Example: correlate data quality alerts with model metrics
import mlflow
import pandas as pd

# Load data quality monitor output
drift_metrics = pd.read_parquet(
    "s3://monitoring/data_quality_metrics/user_activity_features/"
)

# Load MLflow experiment runs for the production model
client = mlflow.MlflowClient()
runs = client.search_runs(
    experiment_ids=["churn_prediction"],
    filter_string="tags.env = 'production'",
    order_by=["start_time DESC"]
)

# Check correlation between feature drift and model AUC
for run in runs:
    run_date = pd.Timestamp(run.info.start_time, unit="ms").date()
    feature_drift = drift_metrics[
        drift_metrics["date"] == str(run_date)
    ]["session_count_drift_score"].values

    if len(feature_drift) > 0:
        print(f"Date: {run_date}, AUC: {run.data.metrics.get('auc', 'N/A')}, "
              f"Session Count Drift: {feature_drift[0]:.3f}")
CI/CD for ML Pipelines: Where MLflow Fits
CI/CD for machine learning requires validation gates that check not just whether code compiles, but whether the trained model meets quality thresholds before it can be promoted to production.
MLflow’s model registry provides the infrastructure for this gate. A CI pipeline that trains a new model version can use MLflow’s API to check whether the candidate model meets minimum metrics before allowing a production deployment:
import mlflow

def validate_and_promote_model(run_id: str, min_auc: float = 0.90) -> bool:
    """
    Validate a model run and promote to production if metrics pass.
    Used in CI/CD pipeline gate.
    """
    client = mlflow.MlflowClient()
    run = client.get_run(run_id)

    auc = run.data.metrics.get("auc", 0.0)
    if auc < min_auc:
        print(f"FAIL: AUC {auc:.3f} below threshold {min_auc}")
        return False

    # Check data quality metrics from the training run
    training_dataset = client.get_run(run_id).inputs.dataset_inputs[0]

    # Promote to candidate stage if metrics pass
    model_version = client.create_model_version(
        name="churn_predictor",
        source=f"runs:/{run_id}/model",
        run_id=run_id
    )

    client.transition_model_version_stage(
        name="churn_predictor",
        version=model_version.version,
        stage="Staging"
    )

    print(f"PASS: Model v{model_version.version} promoted to Staging")
    return True
The CI pipeline calls validate_and_promote_model() after each training run. If the model passes, it enters Staging for integration testing. Human approval then promotes it to Production, MLflow’s stage transitions support this workflow directly.
MLflow with Airflow: Scheduling Training and Monitoring Together
Airflow DAGs that combine model training, data quality monitoring, and model validation create a fully automated retraining workflow. When a data quality monitor detects significant feature drift, it can trigger an Airflow DAG that retrains the model on the latest data:
from airflow import DAG
from airflow.operators.python import PythonOperator
from airflow.sensors.base import BaseSensorOperator
from datetime import datetime, timedelta

def check_feature_drift():
    """Check if feature drift exceeds retraining threshold."""
    drift_scores = load_drift_metrics("user_activity_features", days_back=1)
    max_drift = max(drift_scores.values())
    if max_drift > 0.15:  # PSI threshold for significant drift
        raise ValueError(f"Feature drift detected: {max_drift:.3f}")

def retrain_model():
    """Retrain and log to MLflow."""
    with mlflow.start_run(run_name=f"auto_retrain_{datetime.now().date()}"):
        training_data = load_latest_training_data()
        model = train_xgboost(training_data)
        mlflow.log_metric("auc", evaluate_auc(model, validation_data))
        mlflow.xgboost.log_model(model, "model")

with DAG("ml_retraining_pipeline", schedule_interval="@daily") as dag:
    check_drift = PythonOperator(
        task_id="check_feature_drift",
        python_callable=check_feature_drift
    )

    retrain = PythonOperator(
        task_id="retrain_model",
        python_callable=retrain_model
    )

    check_drift >> retrain
This pattern (drift-triggered retraining with MLflow experiment logging), creates a self-maintaining ML system that responds to data pipeline changes without manual intervention from the ML team.
The MLflow Model Registry and Production Deployment
MLflow’s Model Registry is where experimentation transitions to production. The registry tracks model versions, their lifecycle stage (Staging, Production, Archived), and the training metadata (runs, datasets, and lineage), associated with each version.
The lifecycle stage system enables controlled promotions. A data scientist trains a new model version that achieves better performance on validation metrics. They register it in the Model Registry, and it enters the Staging stage. A model review process (which might include automated evaluation against a holdout dataset, human review of the training data and feature set, and comparison against the current production model), gates the promotion to Production.
For regulated industries, this controlled promotion process with full MLflow run metadata creates the audit trail that compliance teams require: exactly which training data snapshot, which code version, and which hyperparameter configuration produced the model that was promoted to production.
MLflow’s Model Registry also integrates with feature stores. When a model is registered, the registry can record which feature view and which point-in-time cutoff was used to generate training features. This integration is critical for detecting training-serving skew, if the feature engineering logic changes between training and serving, the model inputs no longer match what the model was trained on, often causing silent performance degradation without triggering obvious errors.
Experiment Tracking at Scale: Managing Model Development Velocity
Individual experiment tracking is straightforward. Experiment tracking across a team of 20 data scientists working on multiple concurrent projects requires deliberate organizational design.
The key decisions for team-scale experiment tracking:
Experiment and run naming conventions. MLflow organizes runs within experiments. Without naming conventions, experiments become “Untitled” and runs become “run*1234”, unintelligible after a week. Standardize experiment names as {project}/{model_type}/{feature_set} and run names as {date}*{developer}\_{brief_description}.
Hyperparameter tagging. Log all hyperparameters (not just the ones you’re tuning), to enable filtering runs by architecture, optimizer, or data configuration months later. Teams frequently revisit experiments to understand why a particular approach was abandoned. Complete parameter logging makes this retrospective possible.
Model performance baselines. Track a baseline_metric tag on all runs that records the current production model’s performance on the same evaluation set. This makes every experiment run immediately interpretable: is this run better or worse than what’s deployed today?
Artifact storage discipline. Every run that crosses a performance threshold logs its serialized model artifact to MLflow’s artifact store. Every run below threshold does not, to avoid artifact store bloat. Define the threshold in a shared config file so the decision is consistent across the team.
MLflow’s search API enables fleet-level analysis of experiment runs:
import mlflow

# Find all runs from the last 30 days that beat the baseline
runs = mlflow.search_runs(
    experiment_names=["customer-churn/gradient-boosting/v2-features"],
    filter_string="metrics.val_auc > 0.89 AND tags.dataset_version = 'v2025-05'",
    order_by=["metrics.val_auc DESC"],
    max_results=50
)

# Compare against the current production model's metrics
production_auc = 0.876
candidates = runs[runs["metrics.val_auc"] > production_auc * 1.02]  # 2% improvement threshold
print(f"Found {len(candidates)} candidates exceeding the promotion threshold")
This programmatic experiment comparison enables automated model evaluation pipelines that trigger promotion reviews when new training runs exceed the promotion threshold.
Conclusion
MLflow 3’s expansion into GenAI tracing, dataset tracking, and evaluation makes it a more complete observability platform for modern ML systems that blend classical models and generative AI. The integration with data quality monitoring closes the gap between pipeline observability and model observability.
The practical work for data engineering teams is instrumenting pipelines to emit the lineage and quality signals that make this chain navigable: OpenLineage events from Airflow, Spark, and Flink; data quality monitors on feature tables; and MLflow dataset logging in training pipelines.
The most valuable operational improvement from integrated observability is faster root cause analysis for model degradations. Distinguishing data drift from model drift, correlating feature distribution changes with model performance drops, and tracing data quality issues back to specific pipeline runs: all of this is possible today with MLflow 3, Databricks Data Quality Monitoring, and OpenLineage. The tools exist and are stable enough for production use.
Build Observable ML Platforms
For comprehensive guidance on AI-native data architecture, MLOps, and lakehouse integration, pick up The 2026 Guide to Lakehouses, Apache Iceberg and Agentic AI: A Hands-On Practitioner’s Guide to Modern Data Architecture, Open Table Formats, and Agentic AI.
Browse Alex’s other data engineering and analytics books at books.alexmerced.com.
Dremio provides query-accelerated access to your Iceberg training data and feature tables, reducing the compute cost of feature engineering pipelines. Try it free at dremio.com/get-started.